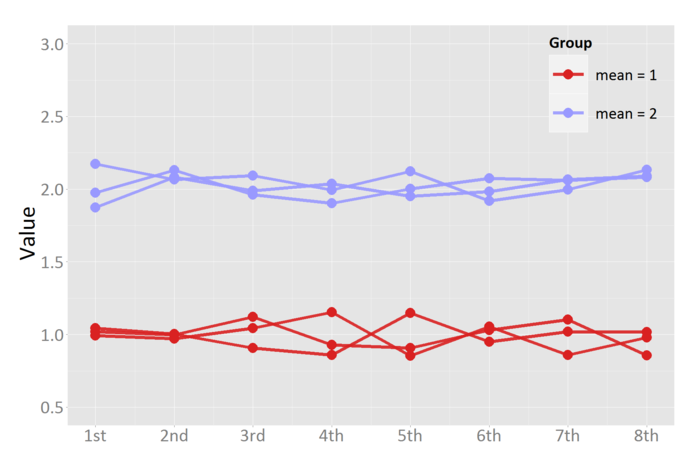
scale_colour_manual を使う事で、ggplot2 で用いられる色のパターンを自分で設定出来るらしいです。
library(ggplot2)
colours <- c("#D92121", "#9999FF", "#D92121", "#21D921", "#FFFF4D", "#FF9326")

d <- data.frame(
  ID = floor(seq(1, 6 + 7/8, by = 1/8)),
  Period = c(1, 2, 3, 4, 5, 6, 7, 8),
  Group = floor(seq(1, 2 + 23/24, by = 1/24)),
  Value = rnorm(8*6, floor(seq(1, 2 + 23/24, by = 1/24)), 0.1)
)
d$Group <- ifelse(d$Group==1, "mean = 1", "mean = 2")

ggplot(d, aes(Period, Value , group = ID, colour = Group)) +
xlab(NULL) +
ylab("Value") +
ylim(c(0.5, 3)) +
geom_line(size=3, alpha = 0.9) +
geom_point(size=12) +
scale_colour_manual("Group", values = colours) +
scale_x_continuous(
  breaks = seq(1,8,by=1),
  labels = c("1st", "2nd", "3rd", "4th", "5th", "6th", "7th", "8th")
)
# + mytheme_gray(base_size = 60, family = "Calibri")
scale_x_continuous; 任意の横軸を設定できるので便利。
改訂履歴
2013/09/03 コードのミス修正 (ggplot2-0.9.3.1 で確認; thanks to 通りすがりです。)
