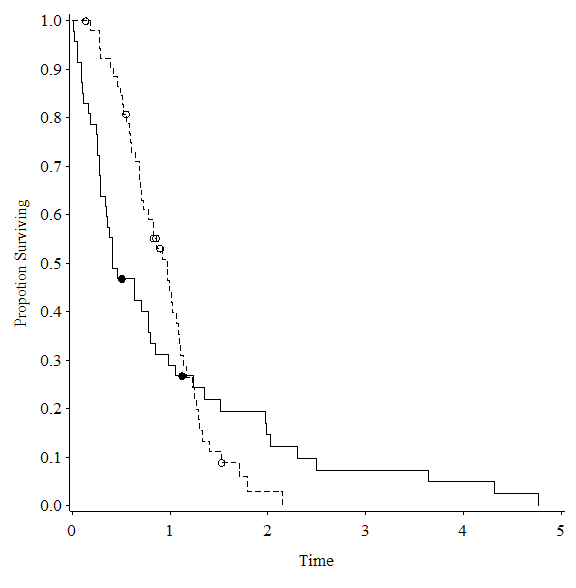
よく使うgoptionときれいなグラフ出力についてまとめてみます。
Lifetest Procedureを使わずにKaplan-Meierプロットを書きたかったときに作ったプログラム。
/* gplot procedureでKaplan-Meierプロット */
%let stra = d1;
%let time = Time;
%let Path = C:\;
%let Name = KMPLOT;

/* Pseudo-random number (mixture Weibull distribution) */
/* censor = 1 */
data mwei;
  call streaminit(070426);
  do i = 1 to 100;
    p = rand('UNIFORM');
    if p > 0.5 then do; d1 = 1; d2 = 0; end;
    else do; d1 = 0; d2 = 1; end;
    if rand('UNIFORM') > 0.9 then censor = 1;
    else censor = 0;
    Time = d1 * rand('WEIBULL', 1, 1) +
           d2 * rand('WEIBULL', 2, 1);
    output;
  end;
run;

proc lifetest data = mwei outsurv = outs;
  time Time * censor(1);
  strata &stra;
run;

proc sort data = outs; by &stra; run;
data outs2;
  set outs; retain Svt 0;
  by &stra;
  if Survival = . then Survival = Svt;
  else Svt = Survival;
  drop STRATUM SDF_LCL SDF_UCL;
run;
data outs2;
  set outs2(where=(_CENSOR_ IN(1)))
      outs2(where=(_CENSOR_ IN(0, .)) drop=Svt);
run;
proc sort data = outs2; by &time; run;

data outs3;
  merge outs2(where=(&stra=0) rename=(Survival=Sv1) drop=Svt)
        outs2(where=(&stra=1) rename=(Survival=Sv2) drop=Svt)
        outs2(where=(&stra=0&Svt1^=.) rename=(Svt=Svt1))
        outs2(where=(&stra=1&Svt2^=.) rename=(Svt=Svt2));
  by &time; drop &stra;
run;
proc sort data = outs3; by &time; run;

goptions reset = all;
goptions ftext = "Times New Roman" ftitle = "Times New Roman"
         htitle = 1.6 htext = 1.6 hsize = 6 in vsize = 6 in;

filename grafout "&Path.&Name..emf";
goptions device=emf gsfname=grafout gsfmode=replace;

options linesize=120 pagesize = 300;

proc gplot data = outs3;
    plot (Sv1 Svt1 Sv2 Svt2) * &time /
          overlay skipmiss noframe
          haxis = axis1 vaxis = axis2;
    axis1 label = ('Time') major=(height=0.25) minor = none;
    axis2 label = (a=90 'Propotion Surviving') minor = none;
    symbol1 i = steplj c=black l=3 ;
    symbol3 i = steplj c=black;
    symbol2 v = circle h = 1 c=black;
    symbol4 v = dot h = 1 c=black;
run; quit;
フォント
SASのデフォルトフォントは正直きつい、いつまであのままなんだ?
goptions ftext = "font name" ftitle = "font name";
ftextはグラフ内の文字、ftitleはタイトルの文字のフォントを指定できます。
個人的にはTimes New Romanかな、小塚とかでもいいけど。
グラフの大きさと文字の大きさのバランス
goptions hsize = 6 in vsize = 6 in
  htitle = 1.6 htext = 1.6;
hsize と vsize はグラフ描画のサイズを指定できます、Horizontal/Vertical。
単位は cm とか mm とか in (インチ) とか。
htitle はグラフ内、htext はタイトルの文字の大きさを指定できます。
この文字の大きさは SAS のアウトプット画面のフォントサイズに依存するというクソ仕様、環境によって表示が全然違ったりすることもあるので出力を見て調整すると良い。
上の設定だと PowerPoint に貼った時に丁度良い、グラフの大きさが 6 in x 6 in で、文字の大きさを 1.6 倍。
出力形式の指定
goptions device = emf gsfname = "file name" gsfmode = replace;
device で出力するファイル形式を指定できます。
bmp, emf, png, gif, jpg, pdfc, tiffp等。
形式によってはグラフ描画のサイズに制限がかかったり、フォント指定をスルーしたりするのに注意すること、bmp か emf が無難。
eps ファイルに出力する場合は SUGI 2005論文集に書いてある方法(一番下) がベスト。
gsfname はファイル名(パスも含む)を指定できます。
gsfmode は replace (置換) か append (追加) を指定できるようだが、append で何が起こるかは不明 (今度やってみよう
その他の注意点
グラフの大きさに比べて文字の大きさが小さい場合、Times New Roman など特定のフォントを使うと
WARNING: Font Times New Roman could not be used.
とログ画面に出力されて、勝手にフォントが変更される場合がある、発動条件が不明。
htitle や htext で文字を大きくするか、SAS 9.1.3 SP4 を入れたらうまくいことがあったような。
あとは goptions はまとめて指定しないでも良いので
goptions ftext = "Times New Roman" ftitle = "Times New Roman";
goptions hsize = 6 in vsize = 6 in htitle = 1.6 htext = 1.6;
goptions device = emf;
と書くこともできます。