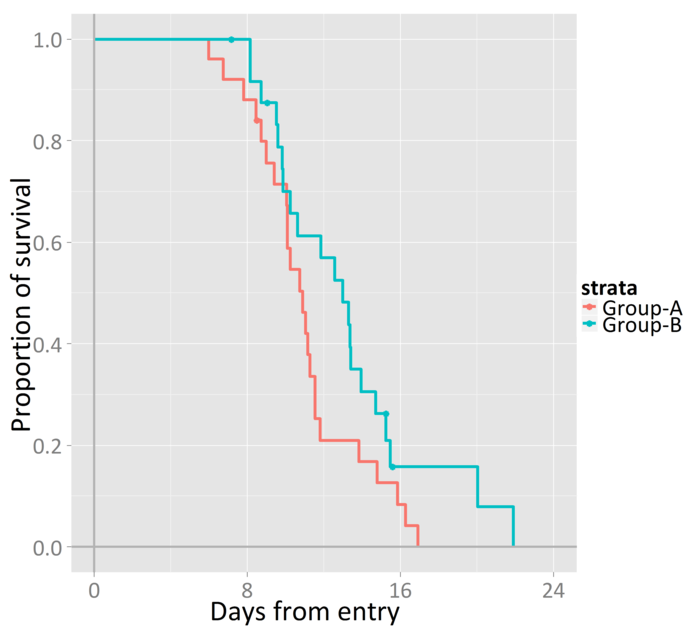
ggplot2 は非常に良いパッケージですね、R をグラフィックスで推すときに、説得力のある実例になるんじゃないかと思いました。
Kaplan-Meier plot の実装例がない様なので、自作してみました。
かなり整理されていなくて申し訳ないのですが、
library(ggplot2)
library(survival)
if (is.na(commandArgs()[6])) {
  path <- "C:/";
} else {
  path <- commandArgs()[6];
}
#######################################################################
mytheme_gray <- function (base_size = 12, family = "") {
  structure(list(
    axis.line = theme_blank(),
    axis.text.x = theme_text(family = family, size = base_size * 0.8,
      lineheight = 0.9, colour = "grey50", vjust = 1),
    axis.text.y = theme_text(family = family, size = base_size * 0.8,
      lineheight = 0.9, colour = "grey50", hjust = 1),
    axis.ticks = theme_segment(colour = "grey50"),
    axis.title.x = theme_text(family = family, size = base_size, vjust = 0.5),
    axis.title.y = theme_text(family = family, size = base_size, angle = 90,
      vjust = 0.5),
    axis.ticks.length = unit(0.15, "cm"),
    axis.ticks.margin = unit(0.2, "cm"),
    legend.background = theme_rect(colour = "white"),
    legend.key = theme_rect(fill = "grey95", colour = "white"),
    legend.key.size = unit(1.2, "lines"),
    legend.text = theme_text(family = family, size = base_size * 0.8),
    legend.title = theme_text(family = family, size = base_size * 0.8,
      face = "bold", hjust = 0),
    legend.position = "right",
    panel.background = theme_rect(fill = "grey90", colour = NA),
    panel.border = theme_blank(),
    panel.grid.major = theme_line(colour = "white"),
    panel.grid.minor = theme_line(colour = "grey95", size = 0.25),
    panel.margin = unit(0.25, "lines"),
    strip.background = theme_rect(fill = "grey80", colour = NA),
    strip.text.x = theme_text(family = family, size = base_size * 0.8),
    strip.text.y = theme_text(family = family, size = base_size * 0.8,
      angle = -90),
    plot.background = theme_rect(colour = NA, fill = "white"),
    plot.title = theme_text(family = family, size = base_size * 1.2),
    plot.margin = unit(c(1, 1, 0.5, 0.5), "lines")), class = "options")
}
#######################################################################
df <- data.frame(
  x = sort(rgamma(50, 12, 1), decreasing = TRUE),
  trt = sample(c("Group-A", "Group-B"), 50, rep = T),
  censor = sample(c(0, 1), 50, rep = T, prob = c(0.1, 0.9))
)

fit <- survfit(Surv(x, censor) ~ trt, df)
fit$strata <- sort(df$trt)
fit <- data.frame(
  time  =fit$time,    surv  =fit$surv,    strata =fit$strata,
  nrisk =fit$n.risk,  nevent=fit$n.event, ncensor=fit$n.censor,
  stderr=fit$std.err, upper =fit$upper,   lower  =fit$lower
)

a <- unique(fit$strata)
for (i in 1:(length(a))) {
  maxnrisk <- max(subset(fit, strata==a[i])$nrisk)
  fit[dim(fit)[1]+1,] <- list(0, 1, a[i], maxnrisk, NA, NA, NA, NA, NA)
}

windowsFonts(Arial="Arial")
windowsFonts(Calibri="Calibri")
windowsFonts(KozukaB="KozGoStd-Bold")
windowsFonts(KozukaR="KozGoStd-Regular")

n_majortick <- 4
n_majortick <- n_majortick - 1
by <- signif(
  (max(fit$time)+n_majortick/2)/n_majortick, -round(log10(max(fit$time)), 0))
####################
### no. at risk  ###
### を入れる予定 ###
####################


cens <- subset(fit, ncensor==1)

plot1 <- ggplot(fit, aes(y=surv, x=time, colour=strata)) +
geom_step(size=1.5) +
xlab("Days from entry") +
ylab("Proportion of survival") +
geom_point(data=cens, size=3) +
geom_hline(yintercept=0, colour="grey70", size=1.2) +
geom_vline(xintercept=0, colour="grey70", size=1.2) +
scale_x_continuous(breaks = seq(0, by*n_majortick, by = by), limits=c(0, by*n_majortick)) +
mytheme_gray(30, "Calibri")

ggsave(plot=plot1, file="TestKMP.wmf", path=path, width = 10, height = 9)


plot2 <- last_plot() + mytheme_gray(30, "Times")

ggsave(plot=plot2, file="TestKMP.pdf", path=path, width = 10, height = 9)
K-M plotのコア部分は sruvfit 関数を利用しました。
fit <- survfit(Surv(x, censor) ~ trt, df)
fit$strata <- sort(df$trt)
fit <- data.frame(
  time  =fit$time,    surv  =fit$surv,    strata =fit$strata,
  nrisk =fit$n.risk,  nevent=fit$n.event, ncensor=fit$n.censor,
  stderr=fit$std.err, upper =fit$upper,   lower  =fit$lower
)

a <- unique(fit$strata)
for (i in 1:(length(a))) {
  maxnrisk <- max(subset(fit, strata==a[i])$nrisk)
  fit[dim(fit)[1]+1,] <- list(0, 1, a[i], maxnrisk, NA, NA, NA, NA, NA)
}

windowsFonts(Arial="Arial")
windowsFonts(Calibri="Calibri")
windowsFonts(KozukaB="KozGoStd-Bold")
windowsFonts(KozukaR="KozGoStd-Regular")

n_majortick <- 4
n_majortick <- n_majortick - 1
by <- signif(
  (max(fit$time)+n_majortick/2)/n_majortick, -round(log10(max(fit$time)), 0))
####################
### no. at risk  ###
### を入れる予定 ###
####################


cens <- subset(fit, ncensor==1)

plot1 <- ggplot(fit, aes(y=surv, x=time, colour=strata)) +
geom_step(size=1.5) +
xlab("Days from entry") +
ylab("Proportion of survival") +
geom_point(data=cens, size=3) +
geom_hline(yintercept=0, colour="grey70", size=1.2) +
geom_vline(xintercept=0, colour="grey70", size=1.2) +
scale_x_continuous(breaks = seq(0, by*n_majortick, by = by), limits=c(0, by*n_majortick)) +
mytheme_gray(30, "Calibri")

ggsave(plot=plot1, file="TestKMP.wmf", path=path, width = 10, height = 9)


plot2 <- last_plot() + mytheme_gray(30, "Times")

ggsave(plot=plot2, file="TestKMP.pdf", path=path, width = 10, height = 9)
今のところデータフレーム df を投げてプロットさせる形にしています。
データ上は信頼区間や No. at risk 等を持たせているので、ggplot2 側を多少弄って拡張できそうです。
そのうち Rcmdr.Plugin まで含めてパッケージ化しようかなぁと思っています (医薬系に需要がありそうなので、CRAN 登録までしちゃってもいいかも)。
フォントファミリーの変更は、検索してもサッパリ見付からなくて困りましたが、
#######################################################################
mytheme_gray <- function (base_size = 12, family = "") {
  structure(list(
    axis.line = theme_blank(),
    axis.text.x = theme_text(family = family, size = base_size * 0.8,
      lineheight = 0.9, colour = "grey50", vjust = 1),
    axis.text.y = theme_text(family = family, size = base_size * 0.8,
      lineheight = 0.9, colour = "grey50", hjust = 1),
    axis.ticks = theme_segment(colour = "grey50"),
    axis.title.x = theme_text(family = family, size = base_size, vjust = 0.5),
    axis.title.y = theme_text(family = family, size = base_size, angle = 90,
      vjust = 0.5),
    axis.ticks.length = unit(0.15, "cm"),
    axis.ticks.margin = unit(0.2, "cm"),
    legend.background = theme_rect(colour = "white"),
    legend.key = theme_rect(fill = "grey95", colour = "white"),
    legend.key.size = unit(1.2, "lines"),
    legend.text = theme_text(family = family, size = base_size * 0.8),
    legend.title = theme_text(family = family, size = base_size * 0.8,
      face = "bold", hjust = 0),
    legend.position = "right",
    panel.background = theme_rect(fill = "grey90", colour = NA),
    panel.border = theme_blank(),
    panel.grid.major = theme_line(colour = "white"),
    panel.grid.minor = theme_line(colour = "grey95", size = 0.25),
    panel.margin = unit(0.25, "lines"),
    strip.background = theme_rect(fill = "grey80", colour = NA),
    strip.text.x = theme_text(family = family, size = base_size * 0.8),
    strip.text.y = theme_text(family = family, size = base_size * 0.8,
      angle = -90),
    plot.background = theme_rect(colour = NA, fill = "white"),
    plot.title = theme_text(family = family, size = base_size * 1.2),
    plot.margin = unit(c(1, 1, 0.5, 0.5), "lines")), class = "options")
}
#######################################################################
theme_gray の定義を流用して、theme_text() に該当する部分をちょこっと修正してあげるだけで簡単に変更できます。
なぜ上のような定義で作らなかったのかが不思議ですが・・・
よく使う人は、オリジナルの theme をいくつか作ってしまった方が良いと思います。
追記
2010-03-06 No. at risk 追加に向けてコードを少し修正
2010-10-30 RcmdrPlugin 試作品を公開 (試作品 (ggplot2 を使った RcmdrPlugin) のファイル)
2011-05-20 Ver. 0.8.9 (2010-12-23) には theme_* 関数に引数 base_family が追加されたようです、geom_text のフォントはまだ theme_* からは変更できない
